SpectrumView Help
Version: 1.2
SpectrumView Audio Spectrum Analysis App in 2 mins
Contents
User interface
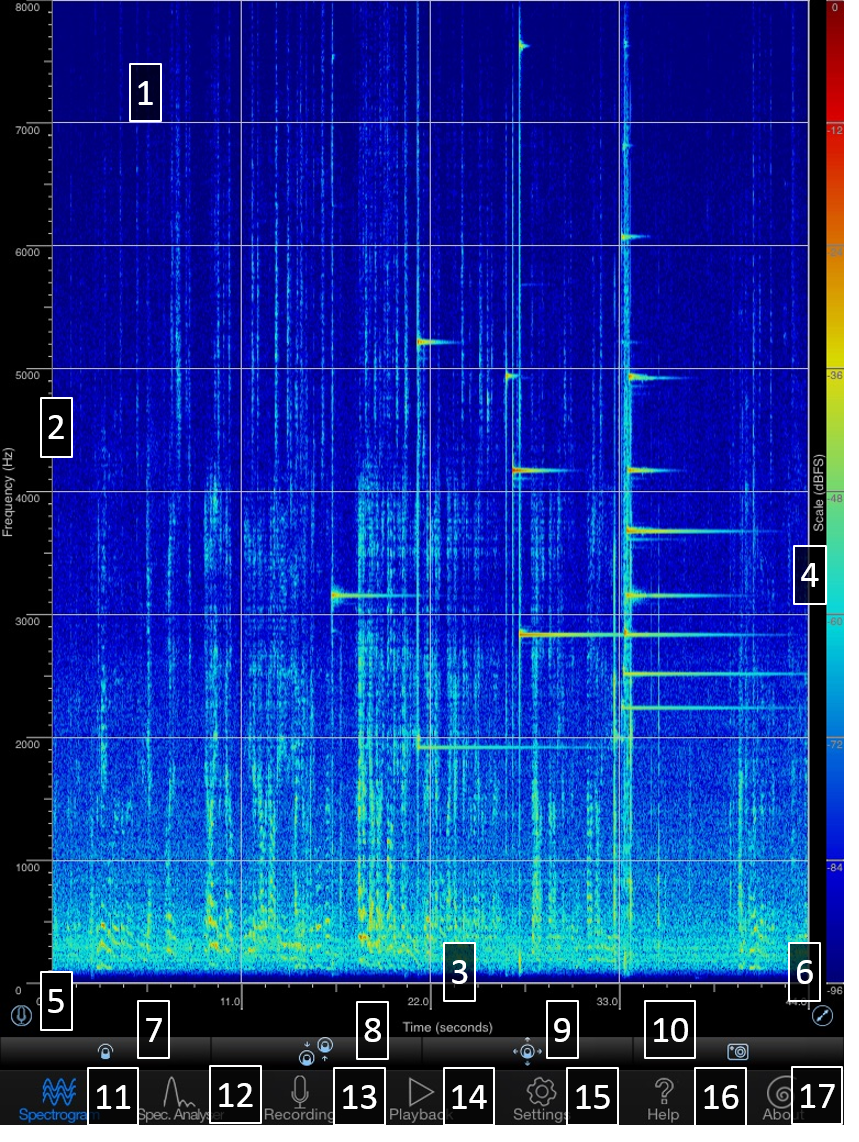
- Spectrogram display
- Frequency scale (Hz)
- Time scale (seconds)
- Decibel Full Scale (dBFS) colour key
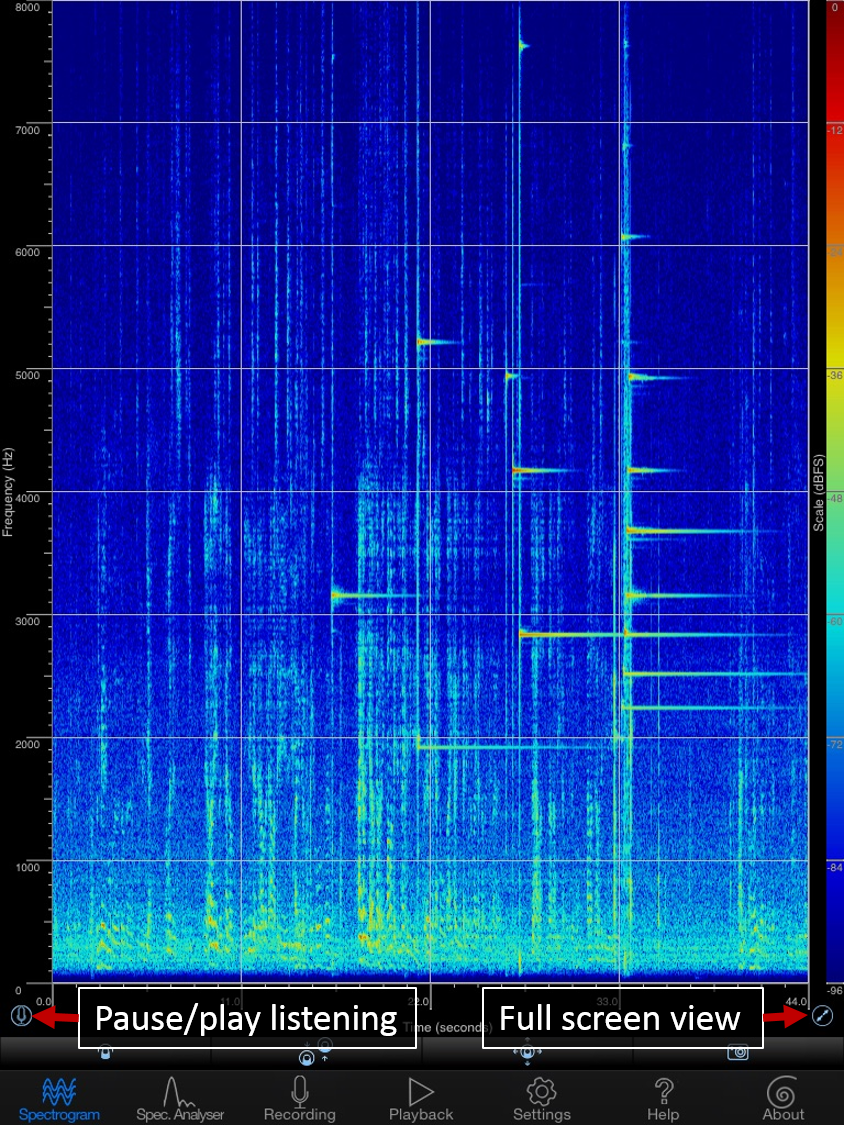
- Record/pause recording/play/pause playback
- Full screen display toggle button
- Tap for details toggle button
- Pinch-to-zoom toggle button PLUS
- Pan display toggle button PLUS
- Screenshot capture button
- Spectrogram mode
- Spectrum analysis mode
- Record mode
- Playback mode
- Settings
- Help page
- About page
Quick-start guide
- Open SpectrumView and it will immediately begin displaying a Spectrogram for sounds around the device once loaded.
 Try clapping or whistling, and you will see the sounds will appear as lines or peaks at their frequencies and with their colour corresponding to their intensity level as per the Decibel Full Scale (dBFS) colour key.
 - You can visualise the sound in a intensity versus frequency display in the Spectrum analysis mode.
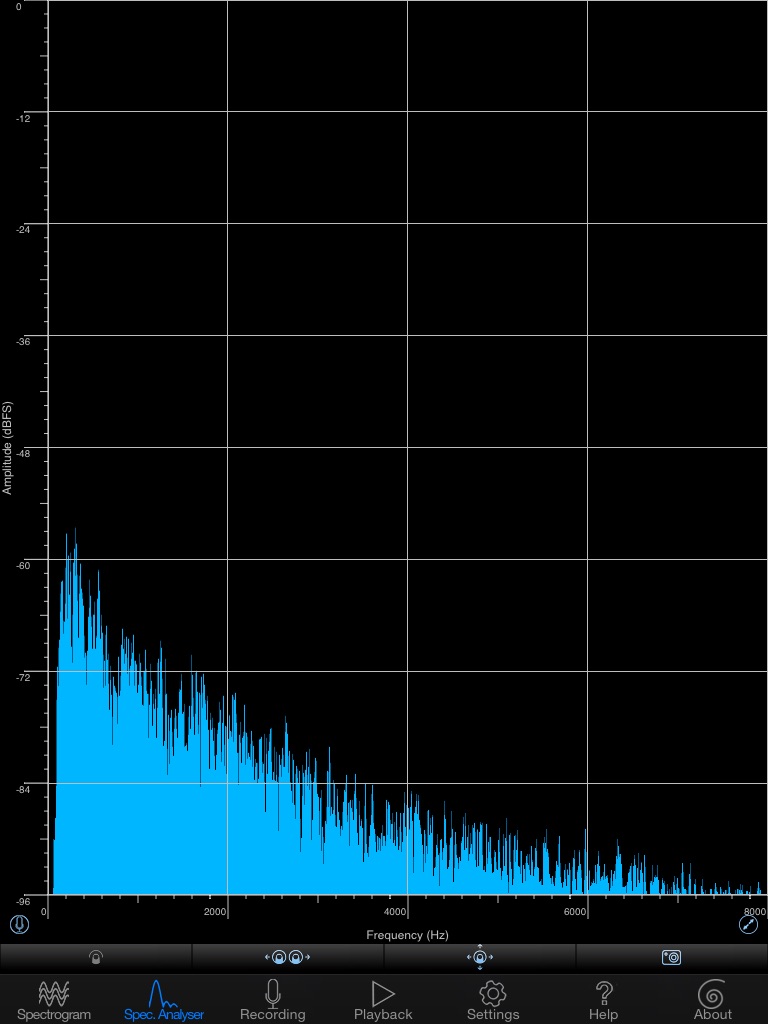 Simply tap the Spectrum Analysis mode button to switch, and hit the Spectrogram mode button to turn back
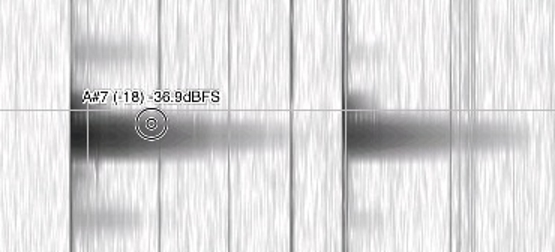
 - If Tap for details is enabled, then tapping a point on either the Spectrogram or Spectrum Analysis will bring up the frequency (Hz) and the intensity (dBFS) for that point.
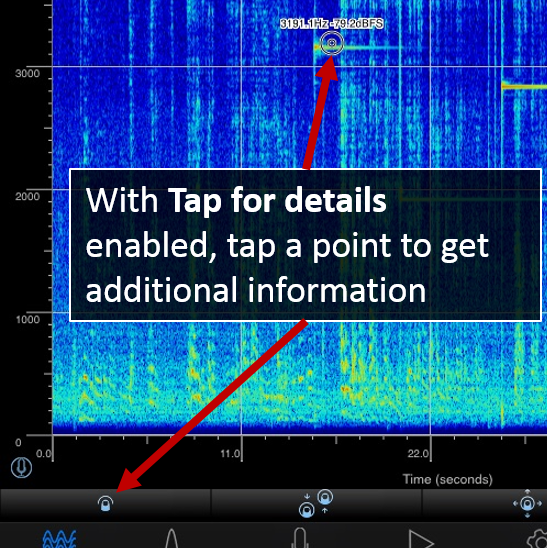 If Musical Notation on tap is enabled in Settings, then the first value will instead be the nearest musical note in scientific pitch notation with the offset in cents (see Settings section for more details).
 - If Pinch-to-zoom PLUS and Pan PLUS are enabled, you can zoom in and pan across the graph with your fingers.
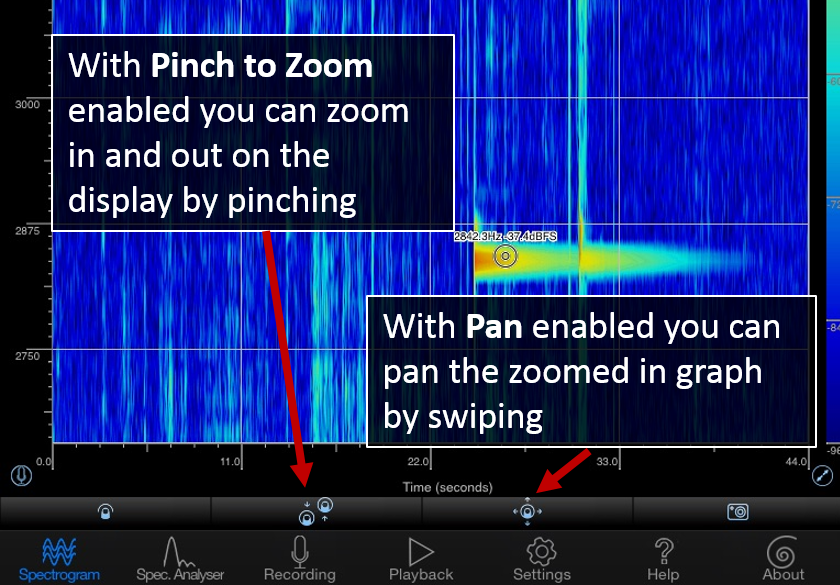 Note that the Pinch-to-zoom and Pan features are exclusive to the Plus edition. The Spectrogram can only be zoomed in vertically, whilst the Spectrum Analysis can only be zoomed in horizontally.
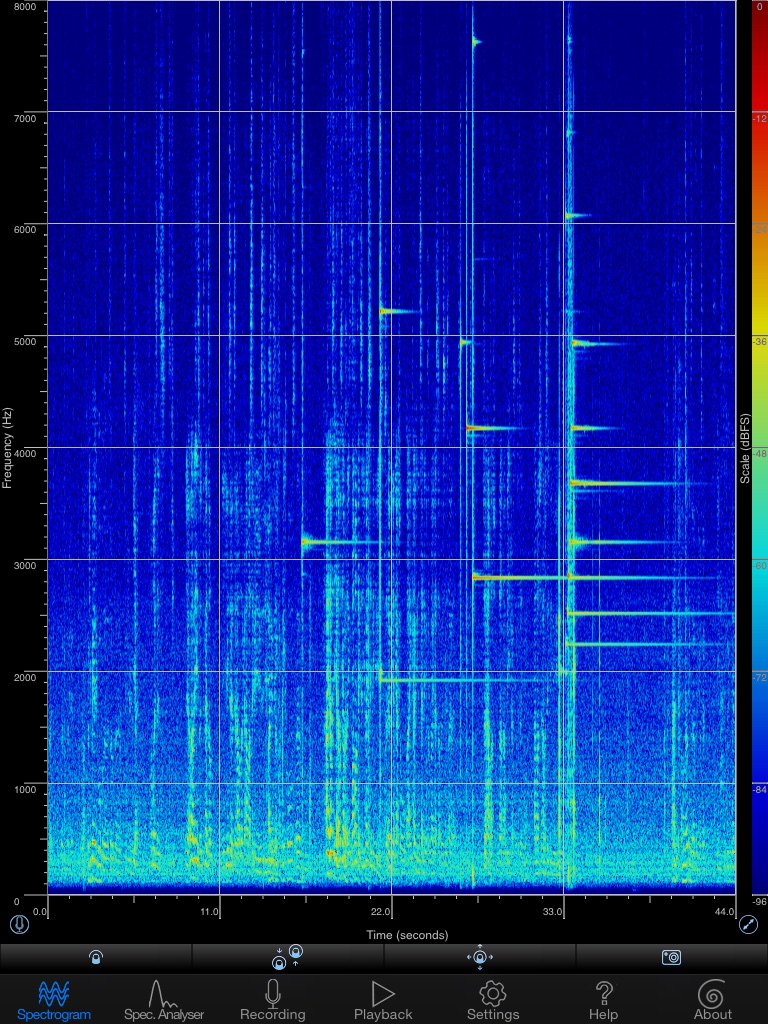
 - The screenshot capture button will take an image capture of the current view. The screenshots are directly stored on the device’s Camera Roll. Unlike Apple’s default screenshot, this will only store the spectrogram and none of the buttons or information around it.
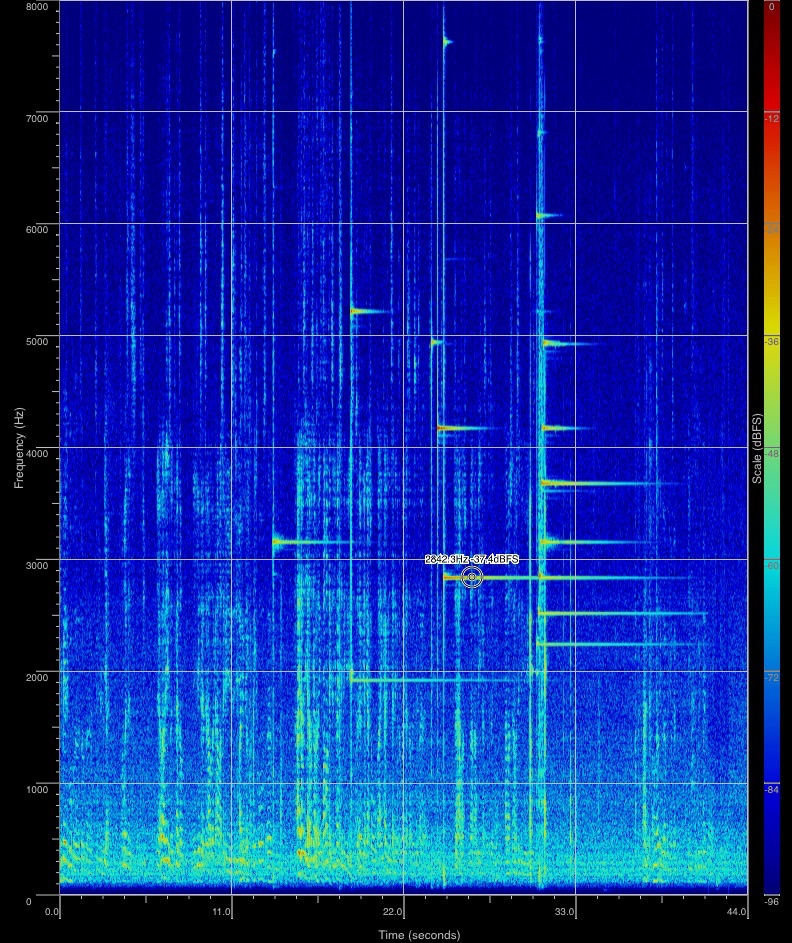
An example screenshot
- In record mode, you can record audio to analyse with your device.
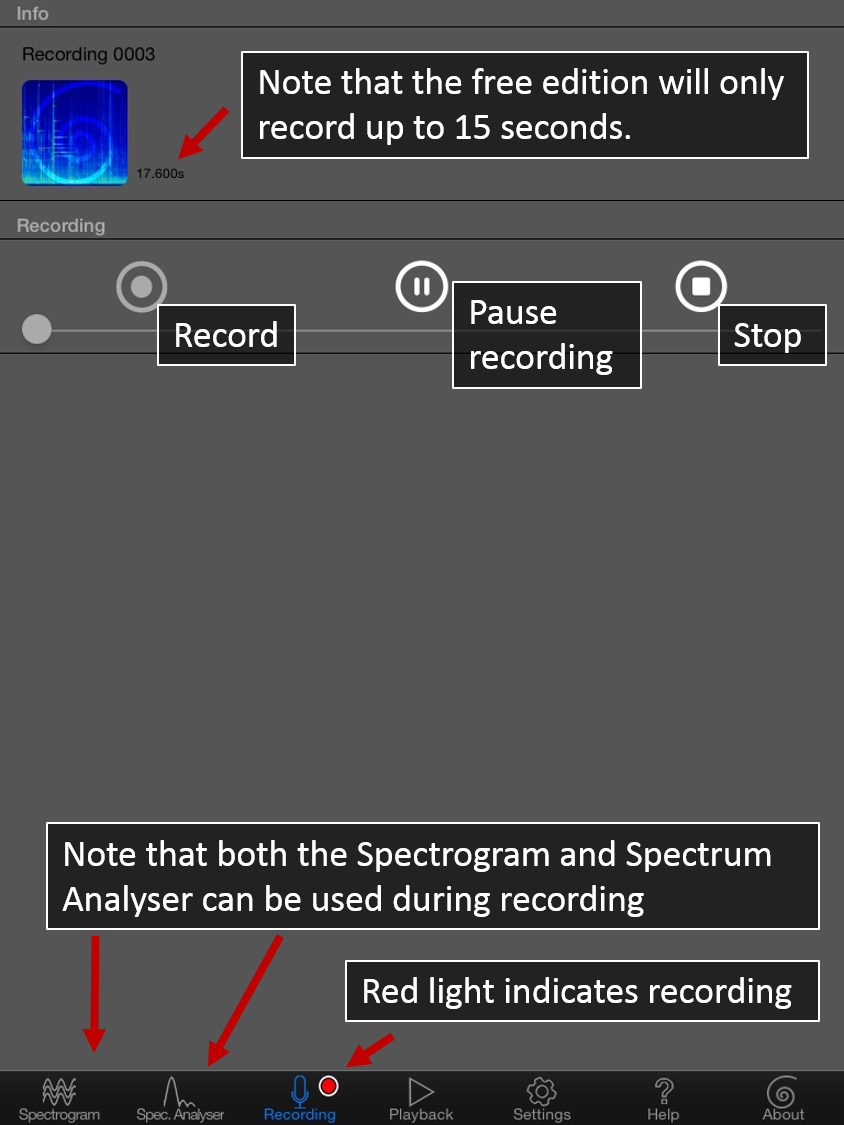 The red light with the recording mode button indicates a recording is in progress. Note that the Free edition is limited to recordings of 15 seconds duration. Both Spectrogram and Spectrum Analysis modes are available to use even whilst recording, and recording can be paused from them with the lower left pause/play button.
 - When you stop the recording, the audio will be stored in SpectrumView’s track library.
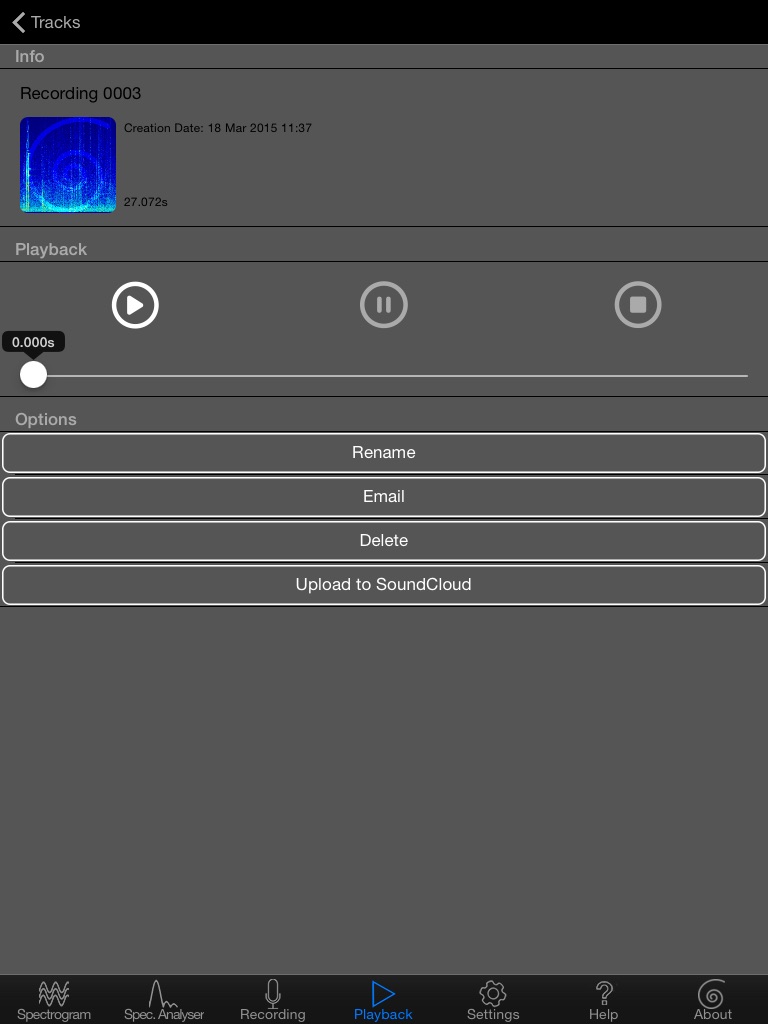 You can then rename, delete or share the recorded track via email or SoundCloud. Note that the track must be less than your email provider’s file size limit in order to share via email.
 - These can be accessed for playback and analysis alongside iTunes PLUS and SoundCloud PLUS tracks in the playback menu.
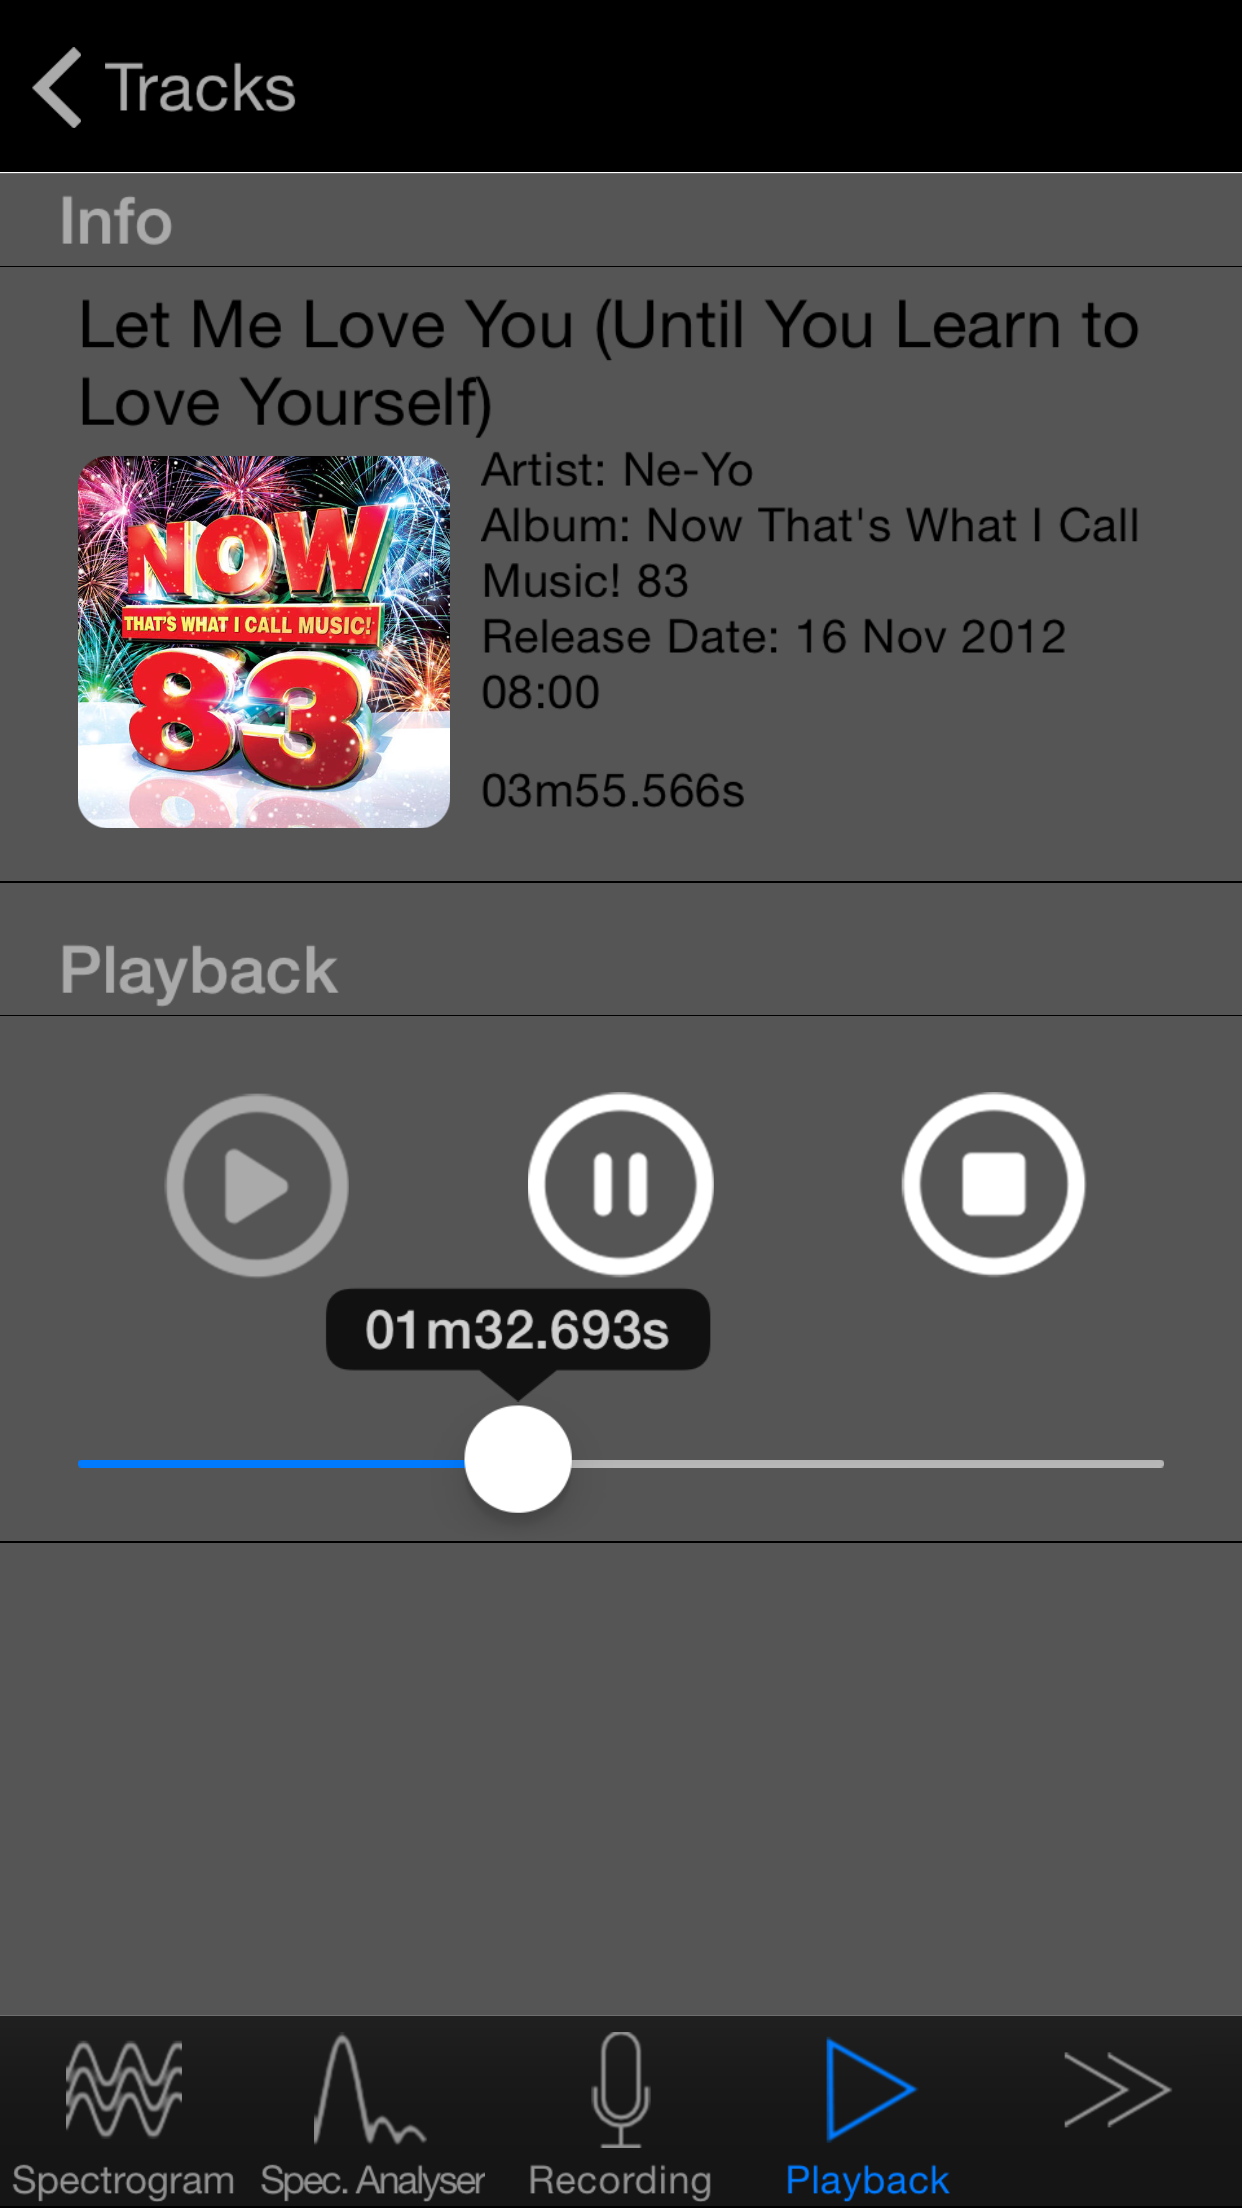
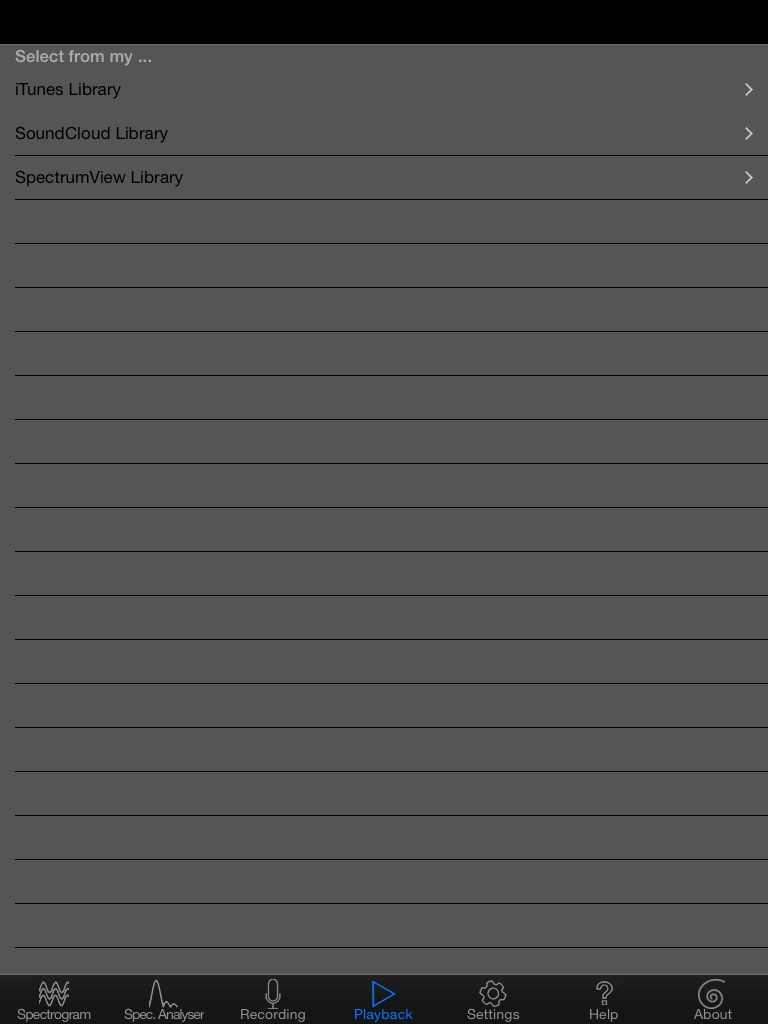 Once playback has started, the Spectrogram and Spectrum Analysis modes can be accessed to review the playing track, and the playing track can be paused with the lower left pause/play button in these view modes. SpectrumView Plus edition fully supports iTunes file sharing which allows you to access your files through iTunes on your computer.
 - You can access and playback any tracks in your iTunes library and review them in the view modes. PLUS
 More details on iTunes file sharing are available here.
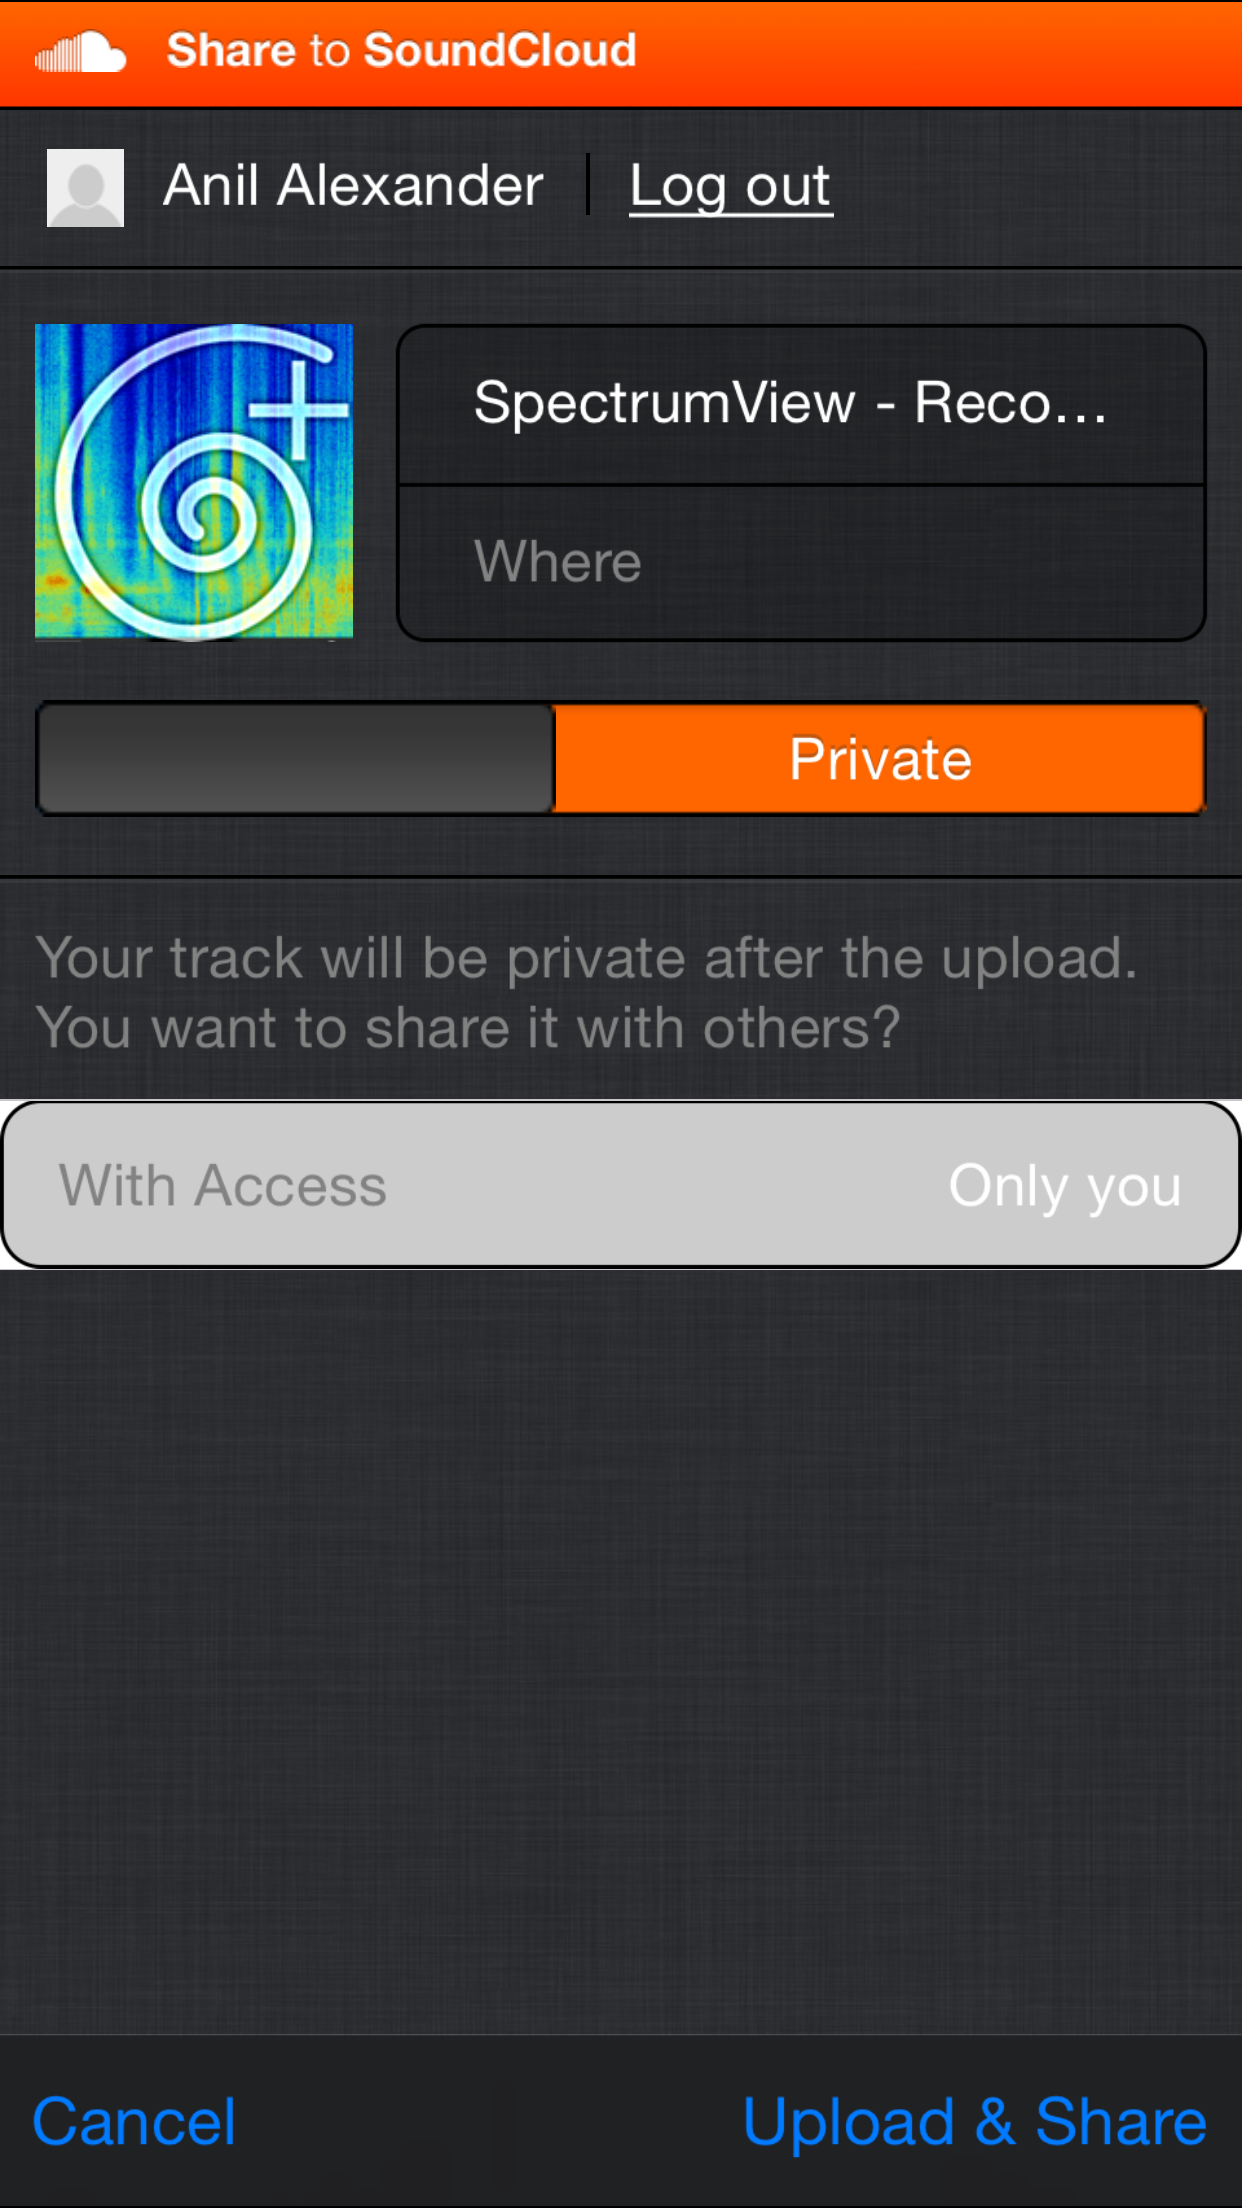
 - If you have a SoundCloud account you can also upload your recorded tracks up to SoundCloud. PLUS
View modes information
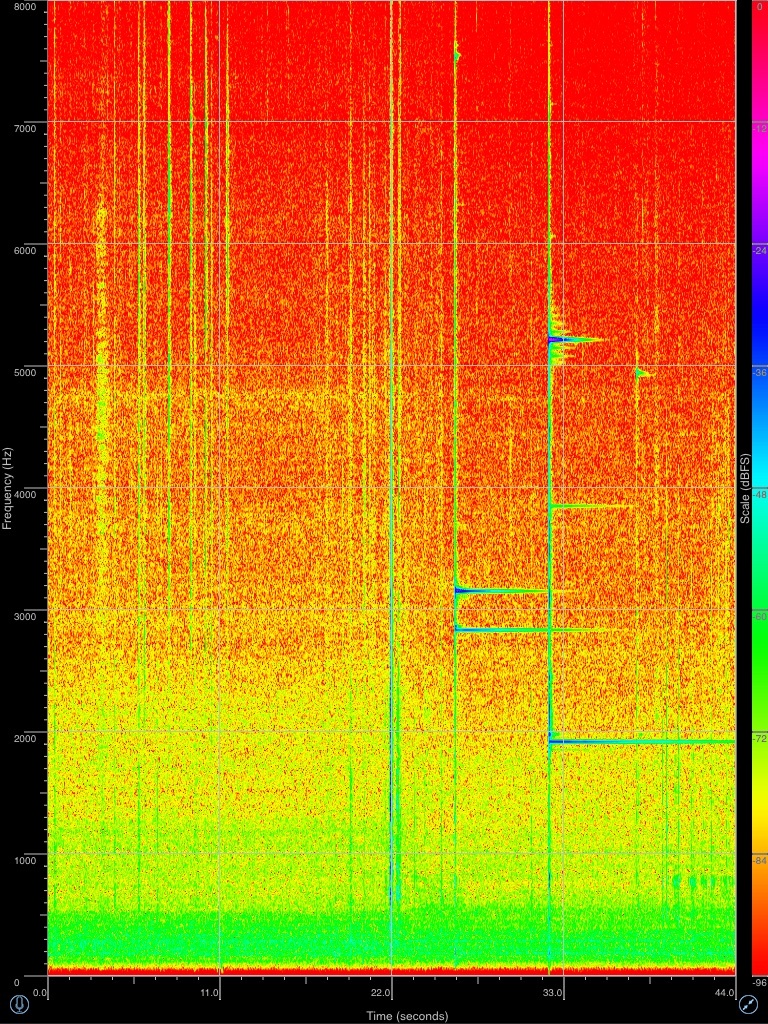
- A spectrogram is a visual representation of sound intensity as it varies through time. This application provides a time-varying display of the frequencies present in the surroundings recorded through the iPhone/iPad’s microphone. The horizontal axis represents time in seconds and the vertical axis represents frequencies in kilohertz (kHz). The intensity of the sound energy present at a given point in time and frequency is illustrated by the colour of the spectrogram. This spectrogram is calculated from the short-time Fourier transform of the audio signal as measured by the microphone. The intensity is represented on a colour scale that spans from -96 dBFS (dark blue) to 0 dBFS (dark red). The resolution and range of frequencies displayed in the Spectrum Analyser can be changed by varying the settings on the Settings tab. By increasing the audio sample rate, higher frequencies can be observed in the display, and by decreasing the sample rate, lower frequencies can be observed.
- The Spectrum Analyser also provides a visual representation of sound intensities in the various frequencies. It differs from the spectrogram by displaying only one time slice at a given point in time. The horizontal axis represents frequency in Hertz and the vertical axis represents the sound intensity at that frequency. The rate at which this display changes depends on the audio sample rate and the FFT order or number of samples analysed (explained below). These parameters can be set using the ‘Settings’ tab. By setting a high FFT order, the Spectrum analyser will update less frequently, as there are fewer audio segments passing through the system. Correspondingly, setting a lower FFT order will have more frequent updates. This depends on the processing capabilities of the device, hence, higher settings will run more smoothly on an iPhone 4, iPad 2 or greater.

- The sound intensity levels are represented in this app using a scale known as the Decibel Full Scale (dBFS). This is an intensity scale used in digital recording and playback. The highest possible level is 0 dBFS and all other values will be less than this and negative. This scale represents the dynamic range of the recording, i.e. the softest sound to the loudest sound it can represent. The range of this scale depends on the bit depth of the recording, i.e. number of bits used to represent each sample. In this app, we choose a bit-depth of 16 bits and thus the scale extends from 0 dBFS to -96 dBFS. While there is no direct conversion between dBFS and the sound pressure scale (db-SPL), it is useful to note that there they are both relative scales: so, a 3 dBSPL drop in sound intensity will result in a drop of 3 dBFS.
Settings
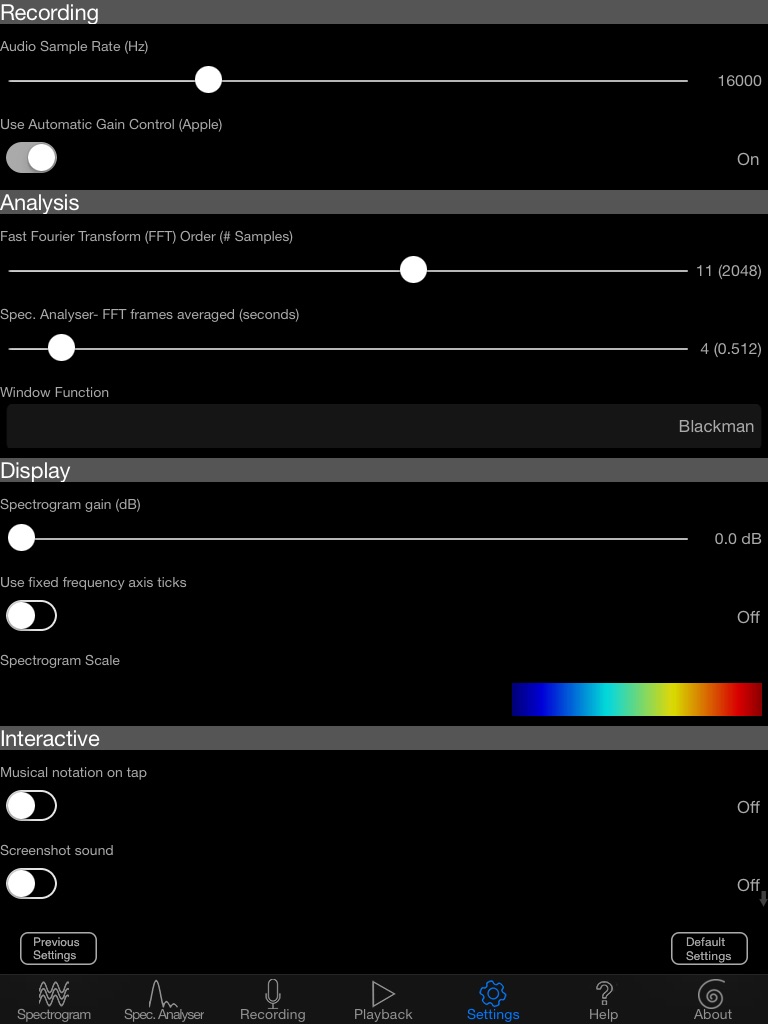
- Audio Sample Rate (Hz): The audio sample rate determines the rate at which the incoming audio is being recorded every second, and this, in turn, determines the maximum frequencies that are recorded. With SpectrumView Plus, it is possible to analyse frequencies up to 24, 000 Hz. The maximum sample rate possible is 48,000 Hz. Bearing in mind that the highest frequencies observable are equal to half the maximum sample rate, please set your frequencies accordingly. For instance, in order to view frequencies that are mainly present in the human voice (between 300 Hz and 3,500 Hz), it may be sufficient to select an 8,000 Hz sampling frequency and in order to visualise frequencies at the upper end of human hearing or above set the sampling rate to the maximum 48,000 Hz. The lower frequency resolution (how clearly the lower frequencies are visible) will be affected by this. The default value is 16000 Hz.
- Automatic Gain Control (Apple): Generally sounds that are captured by the microphone undergo some frequency and amplitude shaping by Apple in order to reduce noise and to provide the best vocals. If you would like to turn off Apple’s proprietary gain control, and directly record the audio you can simply toggle the Automatic Gain Control switch to off. If you switch this on and off the Apple AGC, you can see difference as show below. This is enabled by default.Apple’s Automatic Gain Control (AGC) Turned On (default) and Off
AGC turned on
AGC turned off
- Fast Fourier Transform (FFT) Order (Number of Samples): In order to represent the frequencies present in the audio, we use the Fast Fourier Transform (FFT). The Fourier Transform is a mathematical formulation that allows for time-series data to be converted to equivalent frequency data. It is a compact and meaningful representation based on the fact that segments of signals can be represented in terms of sums of sine and cosine functions. Varying the size of the segment of the signal analysed will change the time and frequency resolution of the display. Using a short segment of the signal will provide poor frequency resolution but good time resolution, and a longer segment of the signal will provide good frequency resolution. It is possible to set the size of the segment of the signal under analysis using the Settings tab. The FFT order refers to the number of samples used to analyse the audio signal as a power of two (e.g. FFT order 8 refers to 2^8 =256 samples under analysis for each frame). This is set at 11 (2048) by default.
- Spec. Analyser FFT frames averaged (seconds): This option allows you to average out the spectrum analysis and observe features of the frequency spectrum that are changing slowly. For instance, if you would like to view the main resonant frequencies of your voice set this option to the number of frames that roughly equals a second. Zooming in to the spectrum analyser will show you peaks at the resonant frequencies of your voice. Increasing this number will help you measure a sustained tone or frequency by stabilising the peaks. This is set at 4 (0.512) by default.
- Window Function: You can choose from a range of available window functions for the Spectogram to use. Available options are:
- Rectangular
- Hann
- Hamming
- Tukey
- Bartlett
- Triangular
- Bartlett-Hanning
- Blackman
- Blackman-Harris
- Flat Top
- Gaussian
This is set to Blackman by default.
- Spectrogram gain (dB): You can apply up to 24 dB of gain to audio being analysed in Spectrogram mode in order to make hard to see details easier to review. There is none by default.
- Used fixed frequency axis ticks: With this enabled, when zooming or panning on either the Spectrogram or Spectrum Analysis graphs, the ticks and grid lines for the frequency axis will be locked and the values will change instead. This is disabled by default.
- Spectrogram Scale: This setting allows you to choose the colour scale for the Spectrogram dBFS values from a set of 7 different colour schemes. It is set to a Blue to Red colour scale by default
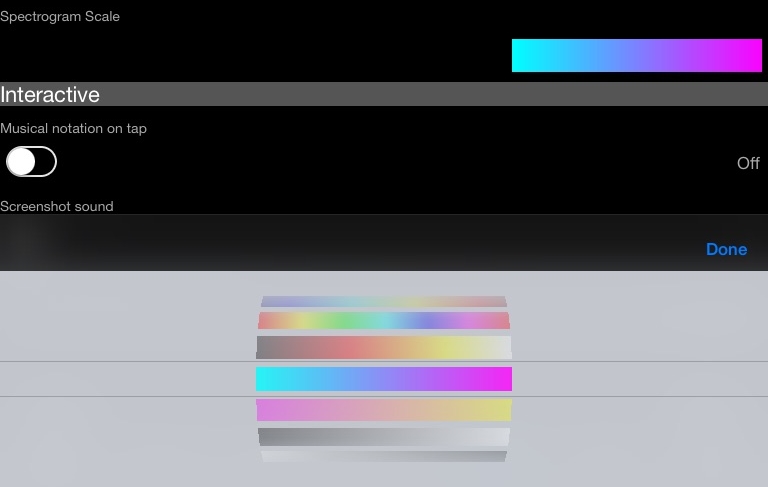
The colour schemes available
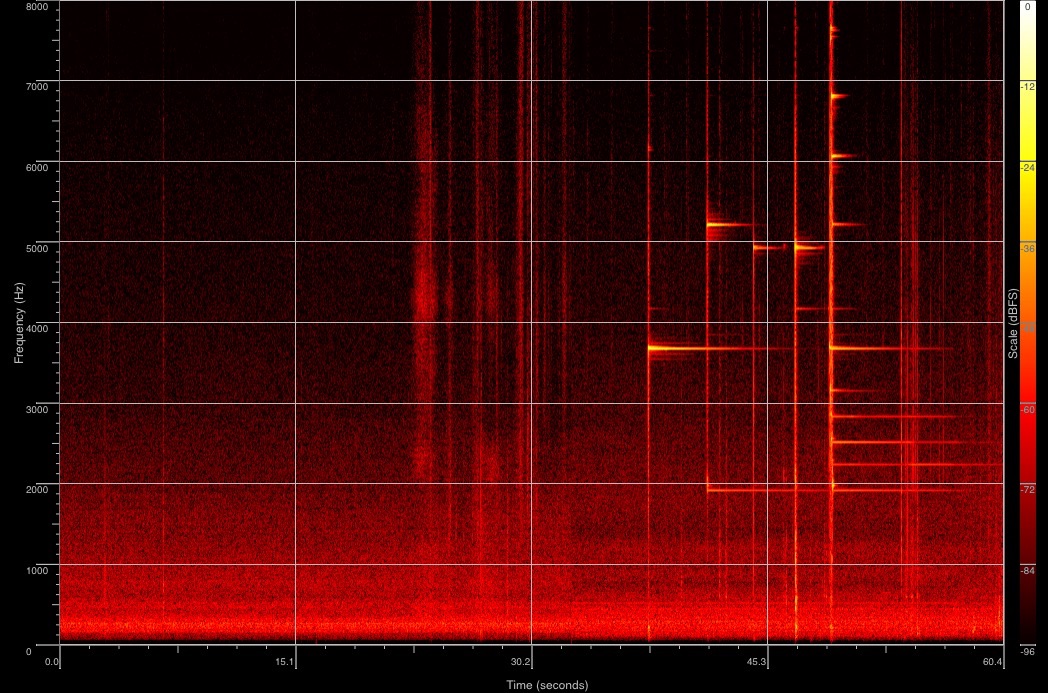
Some example alternate colour schemes
- Musical Notation on Tap: SpectrumView Plus will allow you to tap on anywhere on the Spectrogram or Spectrum Analyser and obtain the exact musical note at that point. The notes are displayed to you in scientific pitch notation (ref: R.W. Young 1939 J.A.S.A). This notation tells you the note (e.g ‘C’) followed by the octave (e.g. ‘4’) as well as telling you how many cents you are away from the perfect note in brackets. An example of this would be a perfect middle-c which will be represented as C4 (0) indicating that the note is a C, is in octave 4, and is 0 cents away from the correct tone. A negative value for cents indicates you have a tone below the note and a positive value indicates a tone above the note. The tone can be a maximum of +/-50 cents away from the note before it is assigned to the next note. This is disabled by default.
- Screenshot Sound: This turns on and off the camera sound you hear when taking a screenshot. Turning it off allows you to prevent the sound from appearing on the spectrogram and spectrum analyser. This is enabled by default.
- When starting playback or recording…: Change how SpectrumView behaves when starting playing a track from playback mode or starting a recording. The default option is ‘Do nothing’, but it can be made instead to go immediately to the Spectrogram or Spectrum Analysis graph modes.
- Default Settings: Restores all settings to their default state.
- Previous Settings: Restores settings to what they were prior to opening the Settings menu.
Feedback form