SpectrumView 2.4 Help

SpectrumView 2.4 Audio Spectrum Analysis App
Contents
User interface
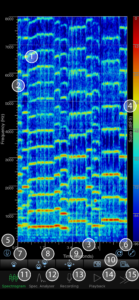
- Spectrogram display
- Frequency scale (Hz)
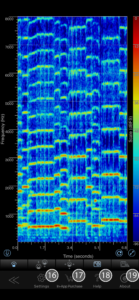
- Time scale (seconds)
- Decibel Full Scale (dBFS) colour key
- Record/pause recording/play/pause playback
- Reset Spectrogram button and Full screen display toggle button
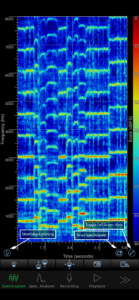
- Tap for details toggle button
- Pinch-to-zoom toggle button PAID
- Pan display toggle button PAID
- Screenshot button and data-snapshot button PAID
- Spectrogram mode
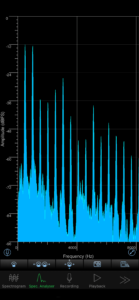
- Spectrum analyser mode
- Record mode
- Playback mode
- Go to next/previous set of navigation buttons (Should be tapped to see 16-19 below)
- Settings
- In-App Purchase
- Help page
- About page
Quick-start guide
-
- Open SpectrumView and it will immediately begin displaying a Spectrogram for sounds around the device once loaded.
-
- Try clapping or whistling, and you will see that the sounds will appear as lines or peaks at their frequencies and with their colour corresponding to their intensity level as per the Decibel Full Scale (dBFS) colour key.
- You can visualise the sound in an intensity versus frequency display in the Spectrum analyser mode. Simply tap the Spectrum Analyser mode button to switch, and hit the Spectrogram mode button to turn back.
-
- If Enable Peak Hold PAID is enabled in settings, simply tap with two fingers to hold the current peak in the graph, this can be done up to 3 times with 3 different colours. To remove the previously created hold, swipe up with two fingers.
-
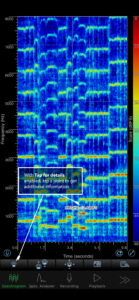
- If Tap for details is enabled, then tapping a point on either the Spectrogram or Spectrum Analyser will bring up the frequency (Hz) and the intensity (dBFS) for that point.
-
- If Musical pitch on tap is enabled in Settings, then the first value will instead be the nearest musical note in scientific pitch notation with the offset in cents (see Settings section for more details).
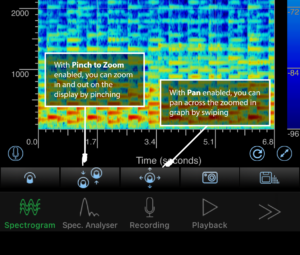
- If Pinch-to-zoom PAID and Pan PAID are enabled, you can zoom in and pan across the graph with your fingers.Note that the Pinch-to-zoom and Pan features are exclusive to SpectrumView Plus. The Spectrogram can only be zoomed in vertically, whilst the Spectrum Analyser can only be zoomed in horizontally.
-
- The screenshot capture button (
 ) will take an image capture of the current view. The screenshots are directly stored on the device’s Camera Roll. Unlike Apple’s default screenshot, this will only store the spectrogram and none of the buttons or information around it.
- The screenshot capture button (
An example screenshot
-
- The data-snapshot button (
 ) PAID will take a data capture of the spectrum and save the data in an Excel compatible CSV file. You can access this CSV from the Files app, iTunes or using the Web File Transfer PAID feature.
An example data-snapshot opened in Microsoft Excel
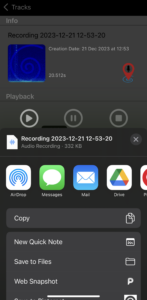
- In record mode, you can record audio to analyse with your device.
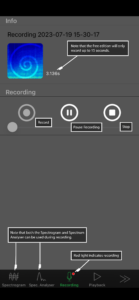 The red light next to the microphone icon in the recording tab indicates that a recording is in progress. Note that the Free edition is limited to recordings of 15 seconds duration, you can increase this to unlimited with either SpectrumView Plus or from the In-App Purchases page. Both Spectrogram and Spectrum Analyser modes are available to use even whilst recording, and recording can be paused from them with the lower left pause/play button.
 - When you stop the recording, the audio will be stored in SpectrumView’s track library.
- The data-snapshot button (
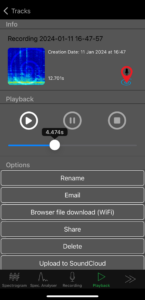
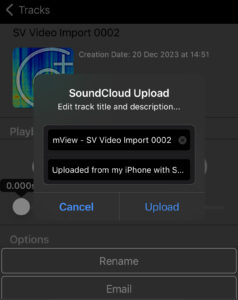
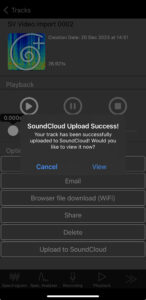
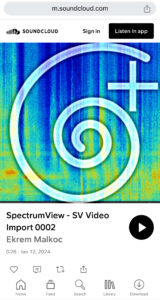
You can then rename, delete or share the recorded track via email, SoundCloud, or your favourite media sharing platform (e.g. iMessage and Facebook Messenger). Note that the track must be less than your provider’s file size/length limit in order to share. This screen also gives you the ability to tap the ‘pin’ icon in the top right to view where the recording was created on a map. Tapping ‘Browser file download (Wi-Fi)’ PAID will display a URL that you can browse to from another computer/phone, on the same Wi-Fi network, to view and download your audio recordings, screenshots, and data-snapshots.
-
- Once playback has started, the Spectrogram and Spectrum Analyser modes can be accessed to review the playing track, and the playing track can be paused with the lower left pause/play button in these view modes. SpectrumView Plus fully supports iTunes file sharing which allows you to access your files through iTunes on your computer.
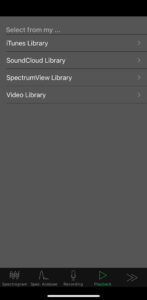
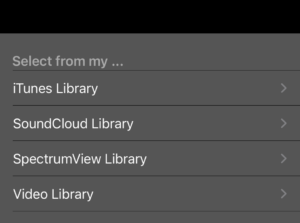
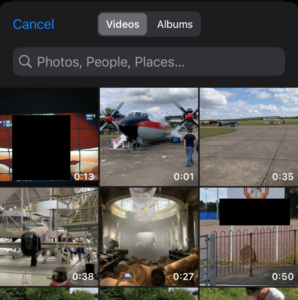
 It is possible to import audio from the videos in the device’s video library by tapping “Video Library” in the “Playback” tab and selecting a video,
-
-
- and then tapping “Choose”.
-

-
-
- This will import the audio in PCM wav format into the SpectrumView library.
-

-
-
- Then, in the Playback tab, the imported audio can be played in Spectrogram and Spec. Analyser viewing modes for further analysis.
-

-
- You can access and playback any tracks in your iTunes library and review them in the view modes. PAID

More details on iTunes file sharing are available here. Note that, whilst the vast majority of iTunes tracks can be imported to SpectrumView without issue, those with DRM, typically audiobooks, should not be loaded, and can cause instability.
-
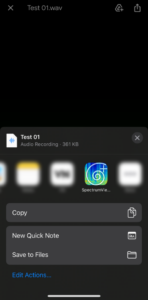
- Tapping the ‘Share’ button in the playback screen will allow you to share your recording using various applications.
-
- You can also open audio files from other iOS applications, for example, the Mail app. Simply tap the ‘Send To’ button (
 ) and select ‘SpectrumView’.
- You can also open audio files from other iOS applications, for example, the Mail app. Simply tap the ‘Send To’ button (
View modes information
-
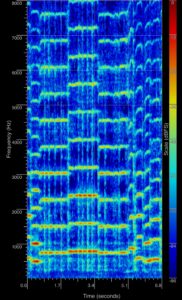
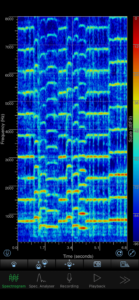
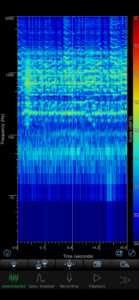
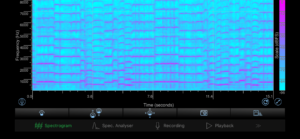
- A spectrogram is a visual representation of sound intensity as it varies through time. This application provides a time-varying display of the frequencies present in the surroundings recorded through the iPhone/iPad’s microphone. The horizontal axis represents time in seconds and the vertical axis represents frequencies in kilohertz (kHz). The intensity of the sound energy present at a given point in time and frequency is illustrated by the colour of the spectrogram. This spectrogram is calculated from the short-time Fourier transform of the audio signal as measured by the microphone. The intensity is represented on a colour scale that spans from -96 dBFS (dark blue) to 0 dBFS (dark red). The resolution and range of frequencies displayed in the Spectrum Analyser can be changed by varying the settings on the Settings tab. By increasing the audio sample rate, higher frequencies can be observed in the display, and by decreasing the sample rate, lower frequencies can be observed.
-
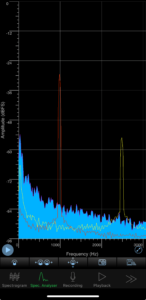
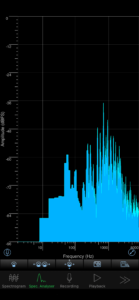
- The Spectrum Analyser also provides a visual representation of sound intensities in the various frequencies. It differs from the spectrogram by displaying only one time slice at a given point in time. The horizontal axis represents frequency in Hertz and the vertical axis represents the sound intensity at that frequency. The rate at which this display changes depends on the audio sample rate and the FFT order or number of samples analysed (explained below). These parameters can be set using the ‘Settings’ tab. By setting a high FFT order, the Spectrum analyser will update less frequently, as there are fewer audio segments passing through the system. Correspondingly, setting a lower FFT order will have more frequent updates.

-
- The sound intensity levels are represented in this app using a scale known as the Decibel Full Scale (dBFS). This is an intensity scale used in digital recording and playback. The highest possible level is 0 dBFS and all other values will be less than this and negative. This scale represents the dynamic range of the recording, i.e. the softest sound to the loudest sound it can represent. The range of this scale depends on the bit depth of the recording, i.e. number of bits used to represent each sample. In this app, we choose a bit-depth of 16 bits and thus the scale extends from 0 dBFS to -96 dBFS. While there is no direct conversion between dBFS and the sound pressure scale (dBSPL), it is useful to note that they are both relative scales: so, a 3 dBSPL drop in sound intensity will result in a drop of 3 dBFS.
Settings
-
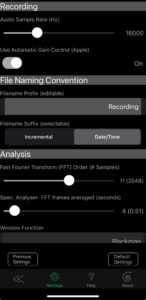
- Audio Sample Rate (Hz): The audio sample rate determines the rate at which the incoming audio is being recorded every second, and this, in turn, determines the maximum frequencies that are recorded. With SpectrumView Plus, it is possible to analyse frequencies up to 24,000 Hz. The maximum sample rate possible is 48,000 Hz. Bearing in mind that the highest frequencies observable are equal to half the maximum sample rate, please set your frequencies accordingly. For instance, in order to view frequencies that are mainly present in the human voice (between 300 Hz and 3,500 Hz), it may be sufficient to select an 8,000 Hz sampling frequency and in order to visualise frequencies at the upper end of human hearing or above, set the sampling rate to the maximum 48,000 Hz. The lower frequency resolution (how clearly the lower frequencies are visible) will be affected by this. The default value is 16,000 Hz.
- Automatic Gain Control (Apple): Generally, sounds that are captured by the microphone undergo some frequency and amplitude shaping by Apple in order to reduce noise and to provide the best vocals. If you would like to turn off Apple’s proprietary gain control, and directly record the audio you can simply toggle the Automatic Gain Control switch to off. If you switch it on and off, you can see difference as shown below. This is enabled by default.
Apple’s Automatic Gain Control (AGC) Turned On (default) and Off
AGC turned on
AGC turned off
- Filename Prefix: When you make a new audio recording in SpectrumView, a filename will be generated for you using this prefix followed by the suffix in the next setting. Leaving this blank will only keep the suffix (e.g. “001”), or providing text such as “Recording” would result in the file being named “Recording 001”.
- Filename Suffix: This suffix will come after the prefix provided in the field above. This can be set to either incremental (“001”, “002”, “003”, etc.) or the Date/Time (e.g. “2018-06-29 15-53-44”).
- Fast Fourier Transform (FFT) Order (Number of Samples): In order to represent the frequencies present in the audio, we use the Fast Fourier Transform (FFT). The Fourier Transform is a mathematical formulation that allows for time-series data to be converted to equivalent frequency data. It is a compact and meaningful representation based on the fact that segments of signals can be represented in terms of sums of sine and cosine functions. Varying the size of the segment of the signal analysed will change the time and frequency resolution of the display. Using a short segment of the signal will provide poor frequency resolution but good time resolution, and a longer segment of the signal will provide good frequency resolution. It is possible to set the size of the segment of the signal under analysis using the Settings tab. The FFT order refers to the number of samples used to analyse the audio signal as a power of two (e.g. FFT order 8 refers to 2^8 =256 samples under analysis for each frame). This is set at 11 (2048) by default.
- Spec. Analyser FFT frames averaged (seconds): This option allows you to average out the spectrum analysis and observe features of the frequency spectrum that are changing slowly. For instance, if you would like to view the main resonant frequencies of your voice, set this option to the number of frames that roughly equals a second. Zooming in to the spectrum analyser will show you peaks at the resonant frequencies of your voice. Increasing this number will help you measure a sustained tone or frequency by stabilising the peaks. This is set at 4 (0.512) by default.
- Window Function: You can choose from a range of available window functions for the Spectogram to use. Available options are:
- Rectangular
- Hann
- Hamming
- Tukey
- Bartlett
- Triangular
- Bartlett-Hanning
- Blackman
- Blackman-Harris
- Flat Top
- Gaussian
This is set to Blackman by default.
- Minimum Frequency (Hz) in view: Sets the minimum Hz to show in both the Spectrogram and Spectrum Analyser views. This makes it easy to view a specific range of frequencies in the views.
- Maximum Frequency (Hz) in view: Sets the maximum Hz to show in both the Spectrogram and Spectrum Analyser views. This makes it easy to view a specific range of frequencies in the views.
- Spectrogram gain (dB): You can apply up to 24 dB of gain to audio being analysed in Spectrogram mode in order to make hard to see details easier to review. There is none by default.
- Use fixed frequency axis ticks: With this enabled, when zooming or panning on either the Spectrogram or Spectrum Analyser graphs, the ticks and grid lines for the frequency axis will be locked and the values will change instead. This is disabled by default.
- Show grid lines: With this enabled, the graph area on the Spectrogram and Spectrum Analyser is squared out into a grid. This is enabled by default.
- Enable peak hold: PAID With this enabled when using the Spectrum Analyser view, you can tap to freeze and hold peaks of the frequency envelope. To do so, simply tap the screen with 2 fingers and a line will be drawn to display the current peak in the analysis audio. This can be done with up to 3 colours, so 3 different peaks can be held simultaneously. To remove the previous peak, simply swipe up on the display with 2 fingers and the last line will be removed.
-
- Enable logarithmic scale: PAID This will enable the logarithmic scale in both the Spectrogram and Spectrum Analyser views. For more information on logarithmic scales, please see here.
Logarithmic Spectrogram View Example
Logarithmic Spectrum Analyser View Example
Spectrogram Scale: This setting allows you to choose the colour scale for the Spectrogram dBFS values from a set of 7 different colour schemes. It is set to a Blue to Red colour scale by default. The colour schemes available
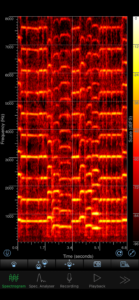
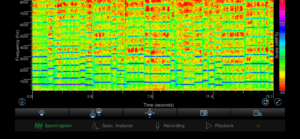
Some example alternate colour schemes
-
- Allow location information: When enabled, after making an audio recording and saving, the location will be attached to the recording. This allows the user to then view where each recording was performed and analyse the audio for that location. To view the location of a recording, simply tap the red pin icon on the audio recording description screen (see example below) and the location of where the recording was taken will be opened in the Apple Maps application.
Tapping the red pin icon will open the recording location in the Apple Maps app
-
- Web File Transfer: PAID This option will only be displayed in SpectrumView Free, or if you have purchased the ‘Access Web File Transfer (Wi-Fi)’ in-app purchase. This feature allows you to access, playback, and download of recordings as well as other files from a web browser on other devices accessible on the same Wi-Fi network. When enabled, this option will show a URL to type into the browser on the other device. It will then display the page shown below, with all of your created recordings, screenshots, and data snapshots.
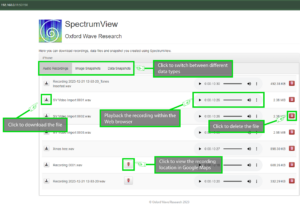
Audio recordings tab
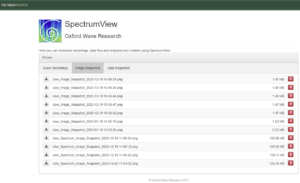
Image snapshots tab
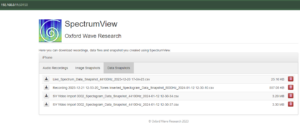
Data snapshots tab
-
-
- Note: When the screen goes into lock-mode, it is not possible to download files via Web File Transfer. If you intend to download files using this option, it is recommended to have “Disable Screen Autolocking” toggled on in the settings, to prevent the device from going into lock mode.
- Musical Pitch on Tap: SpectrumView Plus will allow you to tap on anywhere on the Spectrogram or Spectrum Analyser and obtain the exact musical note at that point. The notes are displayed to you in scientific pitch notation (ref: R.W. Young 1939 J.A.S.A). This notation tells you the note (e.g ‘C’) followed by the octave (e.g. ‘4’) as well as telling you how many cents you are away from the perfect note in brackets. An example of this would be a perfect middle-c which will be represented as C4 (0) indicating that the note is a C, is in octave 4, and is 0 cents away from the correct tone. A negative value for cents indicates you have a tone below the note and a positive value indicates a tone above the note. The tone can be a maximum of +/-50 cents away from the note before it is assigned to the next note. This is disabled by default.
-
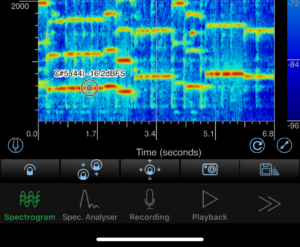
Musical pitch on tap in Spectrogram view
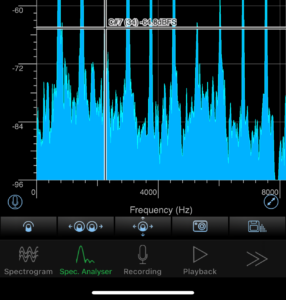
Musical pitch on tap in Spec. Analyser view
-
- Screenshot Sound: This turns on and off the camera sound you hear when taking a screenshot. Turning it off allows you to prevent the sound from appearing on the spectrogram and spectrum analyser. This is enabled by default.
- Disable Screen Autolocking: When enabled, this setting will prevent the device from automatically locking during audio playback and recording. This is an iOS feature that may be set in your devices’ settings (e.g. set to lock after 5 minutes of inactivity).
- When starting playback or recording…: Change how SpectrumView behaves when starting playing a track from playback mode or starting a recording. The default option is ‘Do nothing’, but it can be made instead to go immediately to the Spectrogram or Spectrum Analyser graph modes.
- Default Settings: Restores all settings to their default state.
- Previous Settings: Restores settings to what they were prior to opening the Settings menu.
In-App Purchases
The In-App Purchase tab (not in SpectrumView Plus), contains optional extras that can be purchased to add further functionality to SpectrumView. These features are all available in SpectrumView Plus, but can be purchased individually from the free version of the application. To view more information on the feature, tap the “i” next to it. To purchase a feature, simply tap the button on the right. You will then need to enter your Apple ID authentication details, and you will be able to purchase the feature, which will then be added to the application immediately. This may include adding a toggle option to the ‘Settings’ tab, which may need to be enabled. The restore purchases button will restore any of the features you have purchased in the past if they are not enabled (for example, after deleting and installing the app).  Available purchases: (For more information on these features, read the relevant section above)
- Access Web File Transfer (Wi-Fi): This feature enables access, playback, and download of recordings as well as other files from a web browser on other devices accessible on the same Wi-Fi network.
- Logarithmic Scale: This feature enables logarithmic scale mode in Spectrogram and Spectrum Analyser view.
- Unlimited Recording Length: This feature enables unlimited recording durations. Default recording limit is 15 seconds.
- Pinch To Zoom: This feature allows you to pinch and zoom in both Spectrogram and Spectrum Analyser views.
- Peak hold: This feature enables you to freeze and hold the peaks of the frequency envelope (three holds in three colours) in Spectrum Analyser mode.
- iTunes and Soundcloud Media: This feature enables you to access SoundCloud and iTunes library recordings directly from SpectrumView and analyse them within the app.
- Generate Data Snapshots: Allows you to generate a snapshot of spectrum data from playback and live recordings. Saved in an ‘Excel Accessible’ CSV format.
Data-Snapshots
What is in a Data Snapshot?
In the data-snapshot .csv file, each column represents a slice of the spectrogram. Each row represents a given frequency bin. For the specific time a column represents or frequency a row represents, this will depend on your FFT window size and your sample rate.
For example:
If your sample rate is 16,000Hz and your FFT size is set to 2048 then each slice is, essentially 128ms wide (16,000/2,048). The window is slid on by a half a window length so each window would be 64 ms apart in this example.
Frequency can be calculated similarly:
Using the same numbers as above a 2048 sized window will generate 1,024 frequency “rows”. 16,000Hz can represent a maximum of 8,000Hz (The nyquist rate, 16,000/2). So each frequency “row” is 7.8125 Hz wide (Of course you may also notice that this is 1 over the window width, ie 1/0.128 = 7.8125).
The values stored in the CSV could be a little confusing. Essentially they are a normalised decibel amplitude scale that has been converted to 15-bit integers. As such 32767 represents 0 dBFS and 0 represents (roughly -96.33dBFS).
You can convert back to the original dbFS scale using the following Excel formula (Replacing with the cell you wish to convert):
=((/32767)-1)*20*LOG10(POWER(2,16))
Generating spectrum from data snapshot
- Tap on spectrum analyser tab.
- Spectrum is displayed in the screen.
- On the bottom right of the screen there is a “Data Snapshot” button.
- To use “Data Snapshot” button first it must be in enabled state. If you are a SpectrumView Pro user, Data Snapshot is available already. If you are SpectrumView Free user, you need to purchase this feature from “In-App Purchase”. After the successful purchase “Data Snapshot” button gets enabled.
- Click “Data Snapshot” button to generate Spectrum Analyser data snapshot.
- You can access data snapshot .csv file from iTunes file sharing or you can use “Web File Transfer” option. This option comes for free in SpectrumView Pro. SpectrumView Free user need to purchase this feature from “In-App Purchase”.
- After you have accessed the .csv file you may use it in various Spreadsheet applications like Microsoft Excel, Numbers (in MacOS), etc.
- After opening in any of these applications, you can see a table with two columns where first column represents frequency and the second column represents the data.
- Using Numbers (in MacOS):
- Select entire table.
- On file menu option, select Insert->Chart->2D Area.
- 2D Chart is displayed and you can change its colour using “Chart Colors” option.
- Using Microsoft Excel:
- On file menu option, select Insert->Insert Line or Area Chart->2-D Area->Area.
- Under Chart Tools -> Design select “Select Data”. You will be provided with Select Data source dialog. Here you need to provide the Amplitude data. Click on Add option under Legend Entries (Series).
- Edit Series dialog box will appear. Type “Spectrum Analyser Data” under Series name and Select the range of Data column i.e: B2:B1025 and hit OK.
- “Select Data Source” is displayed again and then click Edit under Horizontal (Category) Axis Labels. Input data range of frequency values i.e. Select Frequency column A2:A1025 and hit OK. Hit OK again in Select Data Source dialog.
- Double click the vertical axis to change the Axis options. Enter Minimum Axis value to be -96.0.
- Double click the horizontal axis and Under Axis Labels select “Low” option which will show your horizontal axis under the chart.
Generating spectrogram from data snapshot
- Tap on Spectrogram tab.
- Spectrogram is displayed in the screen.
- On the bottom right of the screen there is a “Data Snapshot” button.
- To use “Data Snapshot” button first it must be in enabled state. If you are a SpectrumView Pro user, Data Snapshot is available already. If you are a SpectrumView Free user you need to purchase this feature from “In-App Purchase”. After the successful purchase “Data Snapshot” button gets enabled.
- Click “Data Snapshot” button to generate Spectrogram data snapshot.
- You can access data snapshot .csv file from iTunes file sharing or you can use “Web File Transfer” option. This option comes for free in SpectrumView Pro. SpectrumView Free users need to purchase this feature from “In-App Purchase”.
- After you have accessed the .csv file you may use it in various Spreadsheet applications like Microsoft Excel, Numbers (in MacOS), etc.
- After opening in any of these applications, you can see a table with two columns where first column represents frequency and the second column represents the data.
- Using Numbers (in MacOS):
- Select entire table.
- Select Cell tab at the top of the sidebar. If you don’t see a sidebar, or sidebar doesn’t have a Cell tab, click brush icon.
- Click conditional highlighting, then click Add a Rule.
- Choose a “Highlighting Rule” as Numbers.
- You can build up a rule based on equal to, not equal to, greater than, greater than or equal to etc.
- For each rule, select colour fill from dropdown options.
- Zoom-out to 25% to view the spectrogram.
- Using Microsoft Excel:
- Highlight the entire table.
- Under Home-> Conditional Formatting, select “Color Scales” and choose any one colour scale that you feel is appropriate.
- Zoom-out current Sheet to 10% to view spectrogram.
Questions? Please let us know with the contact form below:
Note that we are presently investigating issues with accessing this update on certain older devices no longer supported by Apple, such as the iPad 2. If you are currently using one of these devices, the 2.3 version of the app should still be available to you, the help documentation for which can be found here.
Contact Us